A real-time production monitoring case study showcasing how a food processing facility improved visibility, reduced downtime, and enhanced production efficiency using centralized analytics and dashboards.
The Challenge
The facility relied heavily on manual data collection and post-shift consolidation to understand production performance. This approach resulted in delays, inconsistencies, and limited confidence in the reported numbers. Operators and supervisors had no real-time view of how much was produced at any given moment, which products were running efficiently, or where time and output were being lost. Tracking short stops and breakdowns was another major concern. While stoppages were known to occur frequently, there was no structured way to capture their duration, frequency, or cumulative impact on productivity. As a result, identifying the root causes of performance losses and prioritizing corrective actions was difficult. Additionally, planned production targets were not clearly compared against actual output in real time. This made it challenging for management to assess production compliance during shifts and respond proactively. As product variety and production volumes increased, these limitations began to affect planning accuracy, accountability across teams, and overall operational efficiency.
Our Solution
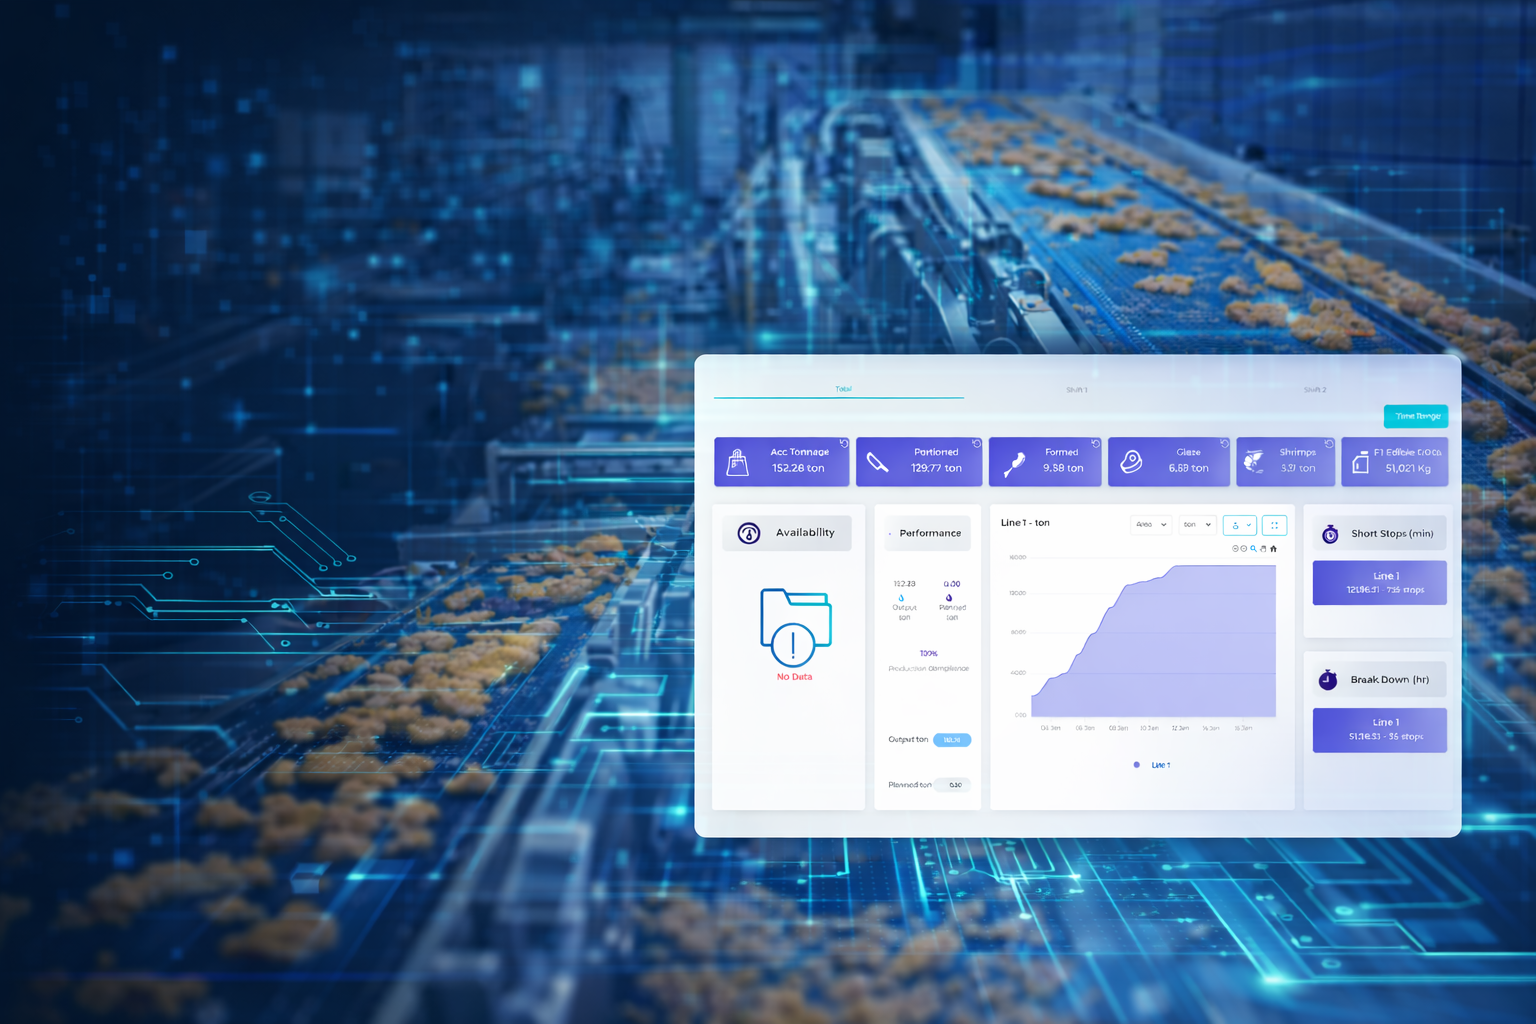
To address these challenges, a centralized, web-based production monitoring and analytics platform was implemented across the facility. The solution digitized production data at the line level and presented it through a single, unified dashboard accessible to both operations and management teams. The system continuously captured real-time production data for each line, including total tonnage, product-wise output, and shift-wise performance. This information was visualized through intuitive dashboards that highlighted key performance indicators such as availability, output trends, and production compliance. Downtime events, including short stops and breakdowns, were systematically recorded and analyzed. The platform provided clear visibility into how often stoppages occurred, how long they lasted, and their cumulative impact on production loss. Trend-based charts allowed teams to observe production behavior over time and identify inefficiencies that were previously hidden in manual reports. In addition, detailed production reports were generated automatically, enabling product-level, batch-level, and shift-level analysis. These reports could be easily exported for reviews, audits, and performance discussions, significantly reducing manual reporting effort.
Key Results
The implementation delivered measurable improvements across operations, efficiency, and cost reduction:
With the new system in place, the facility gained real-time visibility into production performance across all shifts and product categories. Supervisors and managers could instantly see how each line was performing and identify deviations as they occurred rather than after the fact.
The structured tracking of short stops and breakdowns helped the team quickly pinpoint recurring issues and focus on high-impact improvement areas. Production compliance improved as planned targets were continuously compared against actual output, enabling timely corrective actions during shifts.
Manual data handling and post-shift reconciliation were significantly reduced, saving time and improving data reliability. Most importantly, management gained clear, data-driven insights that supported faster decision-making, improved accountability, and continuous operational improvement.
By digitizing production data and transforming it into real-time, actionable insights, the food processing facility achieved better control over its operations. The solution bridged the gap between shop-floor activity and management visibility, enabling smarter decisions, improved efficiency, and a scalable foundation for future production growth.